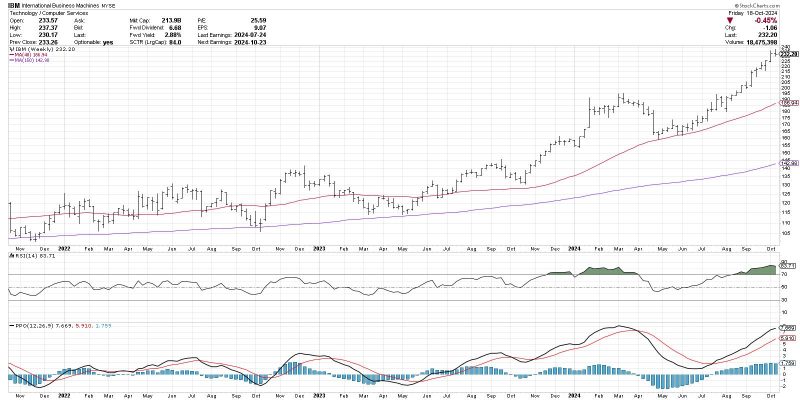
Unveiling the Hidden Secrets of the MACD Histogram for Predicting Trends
The MACD Histogram: A Powerful Tool for Anticipating Trend Changes
Understanding market trends and anticipating changes is crucial for successful trading and investing. Traders often look to technical indicators to gain insight into potential trend shifts. One such indicator that has gained popularity among traders is the Moving Average Convergence Divergence (MACD) Histogram.
The MACD Histogram is a derivative of the MACD indicator, which is used to identify changes in trend momentum. The MACD Histogram represents the difference between the MACD line and the signal line. This visual representation of the difference between two moving averages provides traders with valuable information regarding the strength and direction of a trend.
One of the key advantages of the MACD Histogram is its ability to help traders anticipate trend changes before they occur. By analyzing the slope and magnitude of the Histogram, traders can identify potential shifts in momentum and make informed decisions about entering or exiting trades.
When the MACD Histogram is above the zero line and rising, it indicates that bullish momentum is strengthening. Conversely, when the Histogram is below the zero line and falling, it suggests that bearish momentum is increasing. Traders look for divergences between price action and the MACD Histogram as potential signals of trend reversals.
Another important aspect of the MACD Histogram is its ability to provide early signals of trend exhaustion. As the Histogram approaches extreme levels, it may indicate that the current trend is losing momentum and a reversal could be imminent. Traders can use this information to adjust their positions and take advantage of potential trend changes.
It is essential for traders to use the MACD Histogram in conjunction with other technical indicators and analysis tools to confirm signals and avoid false positives. Combining the MACD Histogram with trendlines, support and resistance levels, and other momentum oscillators can enhance the accuracy of trend change predictions.
In conclusion, the MACD Histogram is a powerful tool for anticipating trend changes in the financial markets. By analyzing the slope, magnitude, and divergences of the Histogram, traders can gain valuable insights into market momentum and make informed trading decisions. When used effectively in conjunction with other technical analysis tools, the MACD Histogram can be a valuable asset in any trader’s toolkit.
