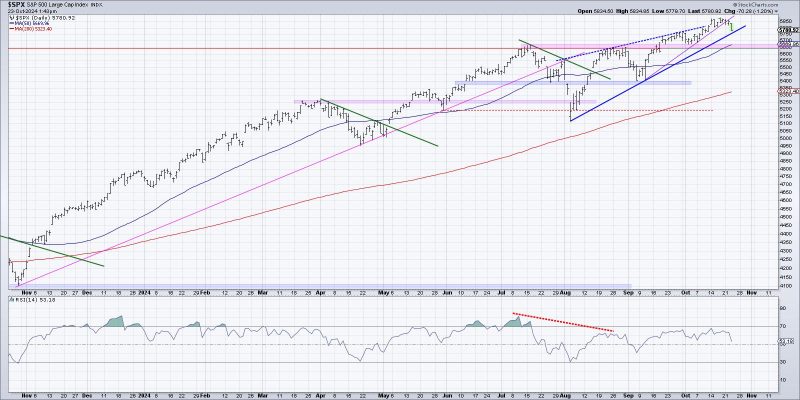
Unlock the Power of Visualization: Sparking the Beginning of a Distribution Phase with Three Proven Techniques
### 1. Bar Chart Analysis:
Bar charts are an effective tool for visualizing the start of a potential distribution phase in a market or stock. By observing the price movements on a bar chart, traders can identify key levels where distribution may be occurring. Look for a series of lower highs and lower lows, which could indicate that selling pressure is increasing and demand is waning. Additionally, pay attention to the volume levels associated with each bar, as a decrease in volume during price rallies could signal a lack of buying interest and strengthen the case for distribution.
### 2. Point and Figure Chart Interpretation:
Point and figure charts offer a unique perspective on market movements and are particularly useful for visualizing potential distribution phases. In these charts, each X represents a price increase, and each O represents a price decrease. Traders can look for specific patterns, such as a series of lower highs and lower lows, which could suggest that supply is overcoming demand and distribution is taking place. By monitoring these patterns and breakouts, traders can anticipate potential downturns in the market.
### 3. On-Balance Volume (OBV) Indicator:
The On-Balance Volume (OBV) indicator is a valuable tool for visualizing the flow of volume in and out of a stock, helping traders identify potential distribution phases. When the OBV line is declining while prices remain relatively flat or show signs of weakness, it could indicate that selling pressure is increasing, and distribution is underway. Traders can use OBV divergence from price movements to confirm the likelihood of a distribution phase, providing valuable insight into market sentiment and potential future price movements.
By utilizing bar charts, point and figure charts, and OBV indicators, traders can effectively visualize the start of a potential distribution phase in a market or stock. These visual tools help traders identify key patterns, trends, and volume movements that may signal the onset of distribution, enabling them to make informed decisions and adapt their trading strategies accordingly.
